
About FlySim
FlySim was founded in 2003 by J.R. Gloudemans and Walter Hsiao.
J.R. Gloudemans
J.R. Gloudemans received his BS and MS in Mechanical Engineering from Virginia Tech. His work at NASA includes RAM, a 3D parameter based aircraft modeler, and bezier surface intersection and trimming libraries. At Shoreline Studios, he assisted in the development and deployment of FoxTrax, a system for enhancing the visibility of the puck in hockey games. As a founding member of Sportvision, he worked on a variety of broadcast enhancements, including AirF/X, Telestrator, K-Zone, SurroundView, and 1st & Ten, where he was the project manager and lead developer.
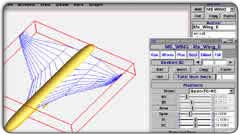
Rapid Aircraft Modeler (RAM)The Rapid Aircraft Modeler is an interactive, parameter-based aircraft modeler used for conceptual design. The models allow visual inspection of the geometric parameters used in aircraft design. The models can also be converted to surface grids for CFD analysis. |

FoxTraxFoxTrax is a system for real time tracking and highlighting of the hockey puck during NHL broadcasts. The FoxTrax system integrates data from sensors placed in the hockey puck, around the arena, and in the broadcast cameras and sends it to Silicon Graphics workstations in the broadcast truck. These computers calculate the exact location of the puck and highlight it in the broadcast video feed. |
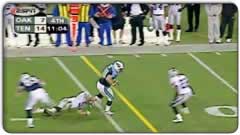
1st & Ten1st and Ten is a broadcast enhancement that lays a first down line on the football field at the location of the first down marker. It debuted on ESPN's Sunday Night Football and has since grown to almost a dozen games a week. 1st & Ten received two Emmy Awards for Innovative Technical Achievement and Outstanding Achievement in Engineering Development. |

SurroundViewSurroundView is a near real time system to generate Bullet Time effects (frozen action with moving camera made popular in The Matrix) at sporting events using off the shelf video equipment. Click here to see SurroundView in action. |
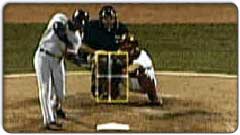
ESPN K-ZoneThe ESPN K-Zone is a system for displaying a graphic over the video feed of a baseball broadcast to show where the baseball punctured the strike zone. The ESPN K-Zone won an Emmy Award for Innovative Technical Achievement. |
Walter Hsiao
Walter Hsiao graduated with a BS in Electrical Engineering and Computer Science from the University of California at Berkeley, with an emphasis on computer graphics and virtual environments. At Books that Work, he worked as an artist and photographer, creating content for 3D Landscape, a virtual walkthrough landscape design product. His work at Sportvision includes broadcast television enhancements such as 1st and Ten and Telestrator. At Silvan Networks he developed web-based global network management and monitoring software and network visualization tools.
1st & Ten1st and Ten is a broadcast enhancement that lays a first down line on the football field at the location of the first down marker. It debuted on ESPN's Sunday Night Football and has since grown to almost a dozen games a week. 1st & Ten received two Emmy Awards for Innovative Technical Achievement and Outstanding Achievement in Engineering Development. |
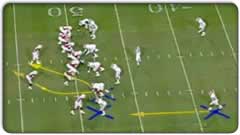
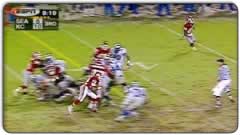
TelestratorBuilt on 1st and Ten technology, the Telestrator allows the user to draw highlights and smoothed lines on the field in real-time or on recorded video. Like the first down line, the telestrator markings are only visible underneath the players and stay locked on the field as the camera moves. The telestration can be recorded and restored during replays. |
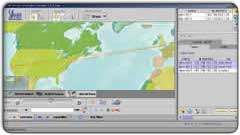
Network Management InterfaceThe Silvan Network Management Interface allowed a user to monitor and configure a globally positioned network of Silvan caches. The software displays different views of the data collected from the deployed caches. Features include regional and world geographic views of the networks, animated panning/zooming, content filtering and selection, diagnostics, and node configuration. |
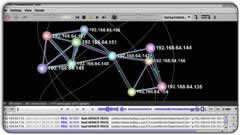
Network Protocol VisualizationThe Silvan Network Protocol Visualizer processes log files and displays the network topology and protocol messages in 3D. Features such as animated playback, 3D navigation, 3D layout algorithms, selection and highlighting tools, message filtration, and an interactive timeline give the user the ability to visually comprehend the flow of data extracted from gigabytes of log files. |